
Table of Contents
- The Formula Behind the Number
- What the Capitalization Rate Actually Measures
- Higher Cap vs. Lower Cap: Reading the Risk Signal
- Cap Rate in Commercial Real Estate Underwriting
- Common Mistakes When You Calculate Cap Rate
- Frequently Asked Questions

Cap rate explained: the capitalization rate divides a property's net operating income by its current market value to express annual return as a percentage. Commercial real estate investors use this single metric to compare assets, assess risk, and negotiate purchase prices without financing variables clouding the analysis.
The Formula Behind the Number
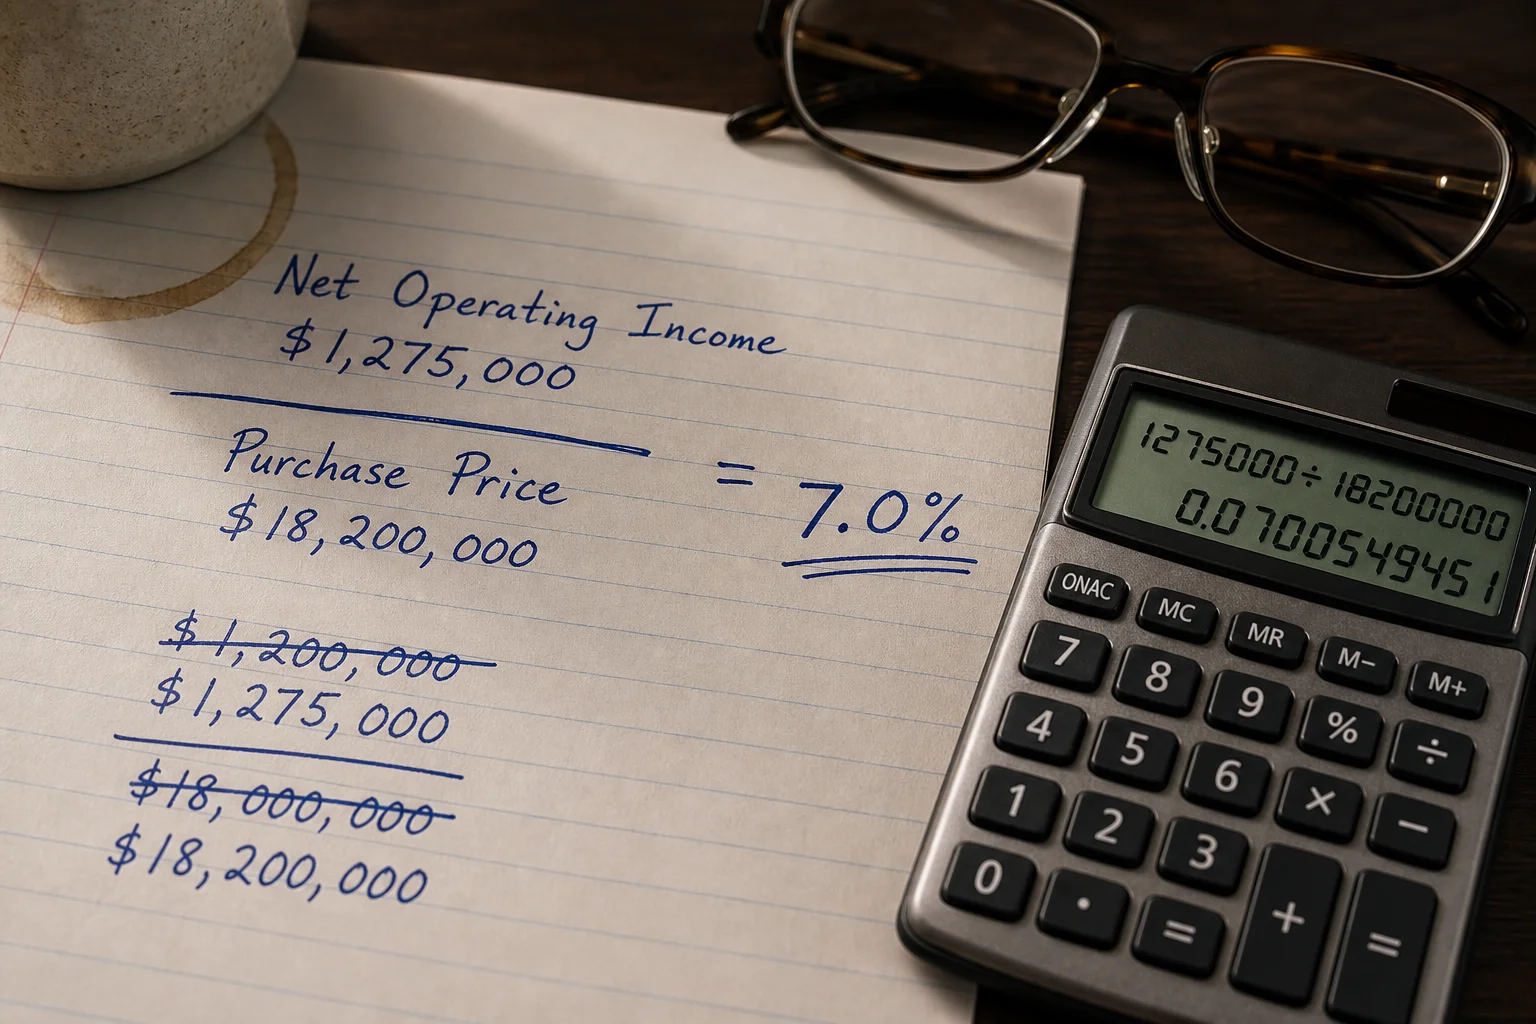
Capitalization rate = Net Operating Income / Current Market Value
Net operating income (NOI) is the annual rental revenue remaining after all operating expenses, excluding debt service and income taxes. Market value is either the current asking price or an appraised figure. The result is expressed as a percentage.
Example: A commercial property generates $120,000 in net operating income noi after expenses. If the market value is $1,500,000, the cap rate is 8%.
$120,000 / $1,500,000 = 0.08, or 8%
That 8% tells you how much the asset produces annually relative to its price, independent of how you finance it. It is the most widely used starting point in commercial real estate valuation.
What the Capitalization Rate Actually Measures
The cap rate is not a measure of cash flow or leverage returns. It measures the unlevered yield of a real estate asset, assuming an all-cash purchase. This distinction matters because two properties with identical cap rates can produce very different cash-on-cash returns once debt is introduced.
What the cap rate captures:
- Income quality: Stable, long-term leases from creditworthy tenants compress cap rates because income risk is low.
- Market pricing: In high-demand urban markets, buyers accept lower yields because they anticipate appreciation.
- Asset class risk: Industrial and multifamily assets typically trade at lower cap rates than retail or hospitality because of perceived stability.
Research published by the National Council of Real Estate Investment Fiduciaries (NCREIF, 2023) found that cap rate spreads over 10-year Treasury yields compress during low-rate cycles and expand during tightening cycles, reflecting the market's risk premium for real estate relative to risk-free assets.
Higher Cap vs. Lower Cap: Reading the Risk Signal
The relationship between risk and yield is direct. A higher cap rate signals higher perceived risk or lower expected growth, while a lower cap rate signals lower risk or stronger growth expectations.
A higher cap means the market is pricing in uncertainty. This could reflect a secondary market location, tenant credit issues, deferred maintenance, or an asset class with volatile demand. Investors who accept a higher cap are compensated for that uncertainty through a larger income yield.
A lower cap means the market is pricing in stability or appreciation. Class A multifamily in a supply-constrained city, for example, trades at a lower cap because buyers expect both steady income and long-term value growth. The trade-off is a thinner income yield relative to purchase price.
Neither is inherently better. The right cap rate for any deal depends on your return investment objectives, hold period, and portfolio strategy.
Cap Rate in Commercial Real Estate Underwriting
When you rate property acquisitions against each other, the cap rate allows an apples-to-apples comparison stripped of financing noise. Underwriters use it in three primary ways.
Pricing a property from NOI
If the market cap rate for similar assets is 6.5% and a target property produces $200,000 in net operating income, the implied value is $200,000 / 0.065 = $3,076,923. This is the most common way commercial brokers arrive at asking prices.
Benchmarking against market cap rates
Comparing a deal's going-in cap rate against current cap rates tells you whether you are buying at a premium, at market, or at a discount. Significant deviation from market averages warrants deeper due diligence.
Exit cap rate modeling
In a discounted cash flow analysis, investors project the cap rate at exit to estimate terminal value. A conservative underwriter assumes the exit cap rate is higher than the entry cap rate, compressing the sale price and stress-testing the return.
For commercial real estate owners who need accurate NOI modeling to support these calculations, clean books and consistent expense categorization are foundational. Errors in operating expense tracking distort net operating income noi, which distorts every valuation derived from it.
Common Mistakes When You Calculate Cap Rate
Using gross rent instead of NOI
Cap rate is calculated on net operating income, not gross rent. Using gross income inflates the apparent yield and produces a misleading comparison.
Including debt service in operating expenses
Mortgage payments are not operating expenses. Including them understates NOI and understates the cap rate, making a property appear riskier than it is.
Ignoring vacancy and credit loss
A realistic NOI assumes a vacancy factor, typically 5 to 10% for stabilized assets. Projecting 100% occupancy overstates income and produces an artificially low cap rate.
Mixing trailing and projected NOI
Trailing 12-month NOI reflects actual performance. Projected forward NOI reflects assumptions. These are not interchangeable in a cap rate calculation. Be explicit about which you are using and why.
Accurate financial data is the foundation on which every cap rate analysis depends. REA's real estate accounting services ensure that the operating income figures flowing into your models are clean, reconciled, and audit-ready.
Frequently Asked Questions
What is a good cap rate for commercial real estate?
There is no universal answer. A good cap rate depends on asset class, location, and your return investment objectives. Class A multifamily in gateway markets often trades at 4 to 5%. Value-add retail or industrial in secondary markets may trade at 7 to 9%. Compare deals against market cap rates for the same asset class and submarket rather than applying a single benchmark across all property types.
How does net operating income affect cap rate?
Net operating income noi is the numerator in the cap rate formula. Higher NOI relative to purchase price produces a higher cap rate. Lower NOI relative to purchase price compresses it. Any improvement to operating efficiency or rental income that grows NOI without a proportional increase in market value raises the cap rate and strengthens the return investment case.
Can cap rates predict appreciation?
Cap rates are a snapshot of income yield at a point in time. They do not directly predict appreciation. However, cap rate compression over time means the market assigns a lower cap to a property category, which implies rising values for assets whose net operating income holds steady. Tracking cap rate trends by submarket is a useful leading indicator for real estate cycles.
What is the difference between cap rate and cash-on-cash return?
The capitalization rate is unlevered and ignores financing. Cash-on-cash return measures actual cash flow relative to equity invested after debt service. The two metrics diverge significantly when leverage is high, which is why both are used together in underwriting rather than relying on cap rate alone.
How does market value affect cap rates?
Market value is the denominator. As values rise in a strong market, cap rates compress even if NOI holds flat. When values fall, cap rates expand. This inverse relationship explains why cap rates and interest rate cycles tend to move together and why understanding market value trends is essential to interpreting any cap rate in context.
Accurate cap rate analysis starts with reliable net operating income data, and reliable data starts with disciplined real estate accounting. Connect with the REA team to learn how outsourced accounting and financial reporting can strengthen the numbers behind every acquisition decision.
Want this handled for you?
Schedule a Call